Qader Qaribiyan
Full Stack Developer with M.Sc in CMS - Visual Computing and experience in the full software development lifecycle from design to deployment with a focus on C#, ASP.NET Core, and Vue.js 3.
Machine Learning in Web
A web-based platform for building machine learning pipelines with integrated tools for PFI, PDP, PCA, t-SNE, and autoencoders. Supports data visualization, explainable AI, and dimensionality reduction. Scales to large datasets via TU Dresden's HPC infrastructure.
Highlights
- 14+ ML models training directly in browser (no backend needed)
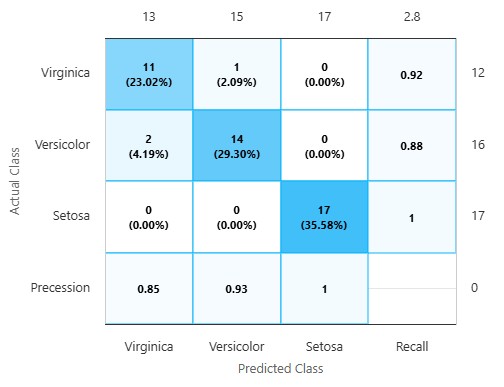
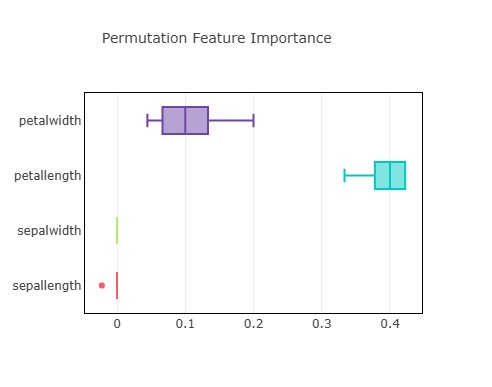
- Explainable AI suite: PDP, PFI, and feature contribution analysis
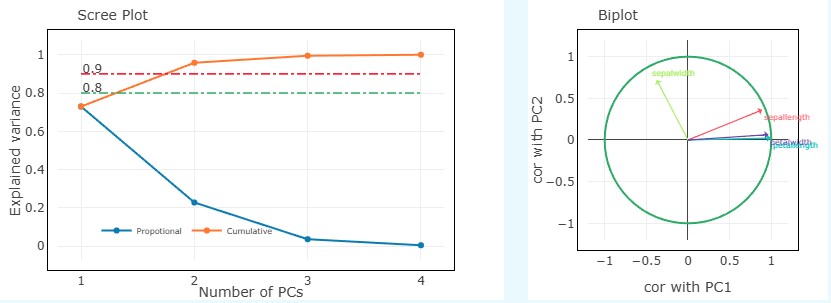
- Dimensionality reduction: PCA (biplots/scree), t-SNE, autoencoders
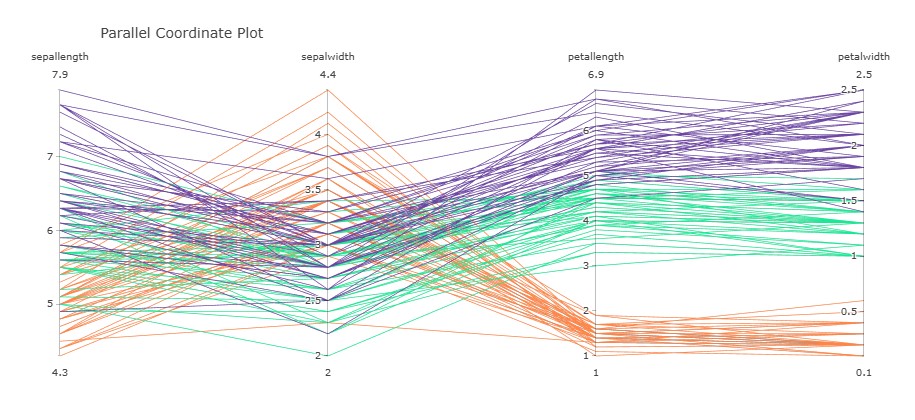
- Interactive visualizations: Parallel coordinates, correlation matrices, model insights
- HPC integration: Scales to large datasets via TU Dresden infrastructure
- Full client-side execution using Pyodide + TensorFlow.js
- Stack: Vue.js 3, Pyodide, Bulma CSS, Scikit-learn, Plotly.js, HighCharts, TensorFlow.js
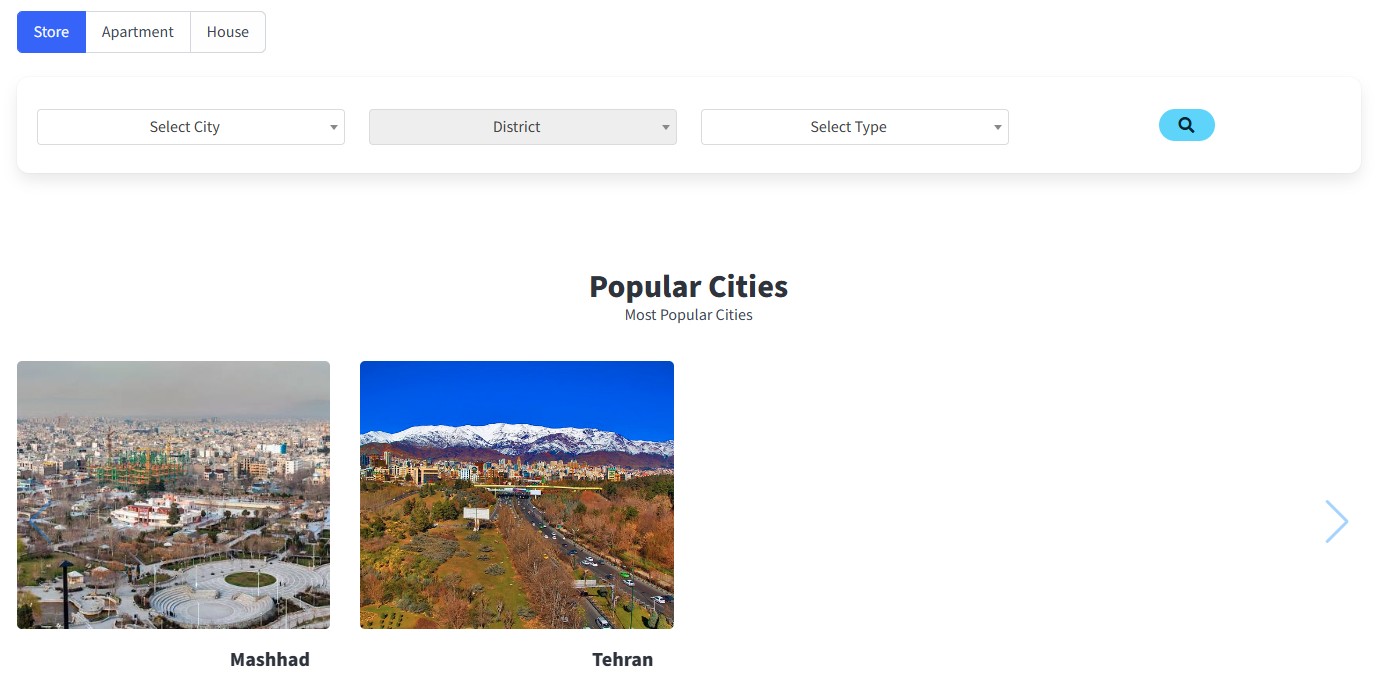
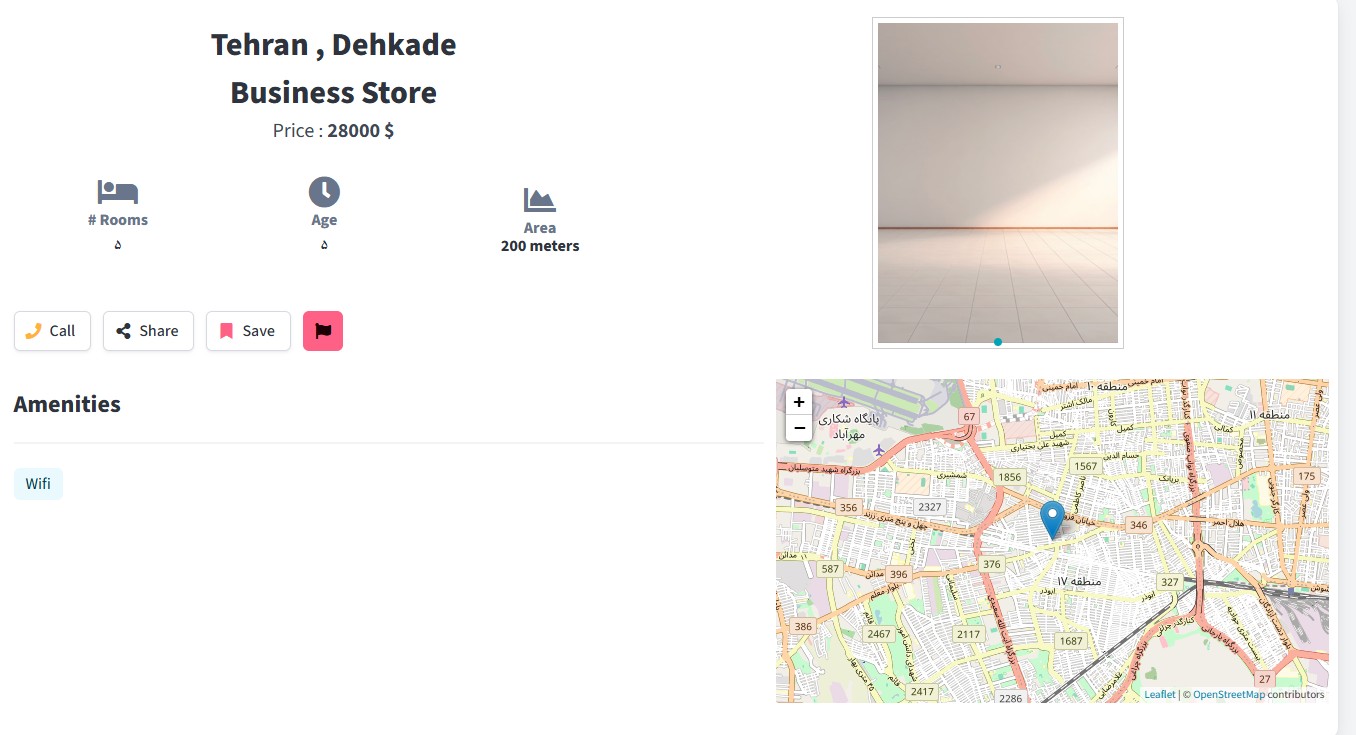
Realtor App
A full-stack real estate management platform with a web frontend built in Vue.js, ASP.NET Core 8, and a SQL Server database.
Highlights
- ASP.NET 8 backend development for property listing platform
- RESTful API design with JWT authentication and authorization
- Azure cloud deployment: App Service, SQL Database, Key Vault
- Secure configuration management using Azure Key Vault
- Device-optimized image rendering service for faster page loads
- Entity Framework Core integration with advanced query optimization
- Role-based access control and secure API endpoint protection
- Automated CI/CD pipeline implementation for Azure deployment
- Stack: ASP.NET Core 8, ABP, Vue.js 2, SQL Server, Swagger UI, Bulma CSS, Bootstrap 4
TDD app with Django 5.0
Developed a CRUD application with TDD methodology.
Highlights
- Full CRUD operations implemented with Django
- one-time code login without traditional signup process
- Test-Driven Development methodology using pytest test suite
- Selenium automated browser testing for end-to-end validation
- Unit tests for models, views, and forms
- Stack: Django 5.0, Selenium automated test framework, pytest, SQLite
The Blackbox of Machine Learning
Explored the blackbox nature of machine learning algorithms by applying PDP,PFI, and SHAP model interpretability techniques to explain ML models' decissions.
Highlights
- Explored PDP, PFI, and SHAP for explaining black box models' predictions and enhancing transparency
- Simulated 8 different scenarios and visualized the methods' explanations with the true DGP
- Benchmarked the methods on 8 public datasets and 12 ML models
- Stack: scikit-learn, pandas, matplot, XGBoost
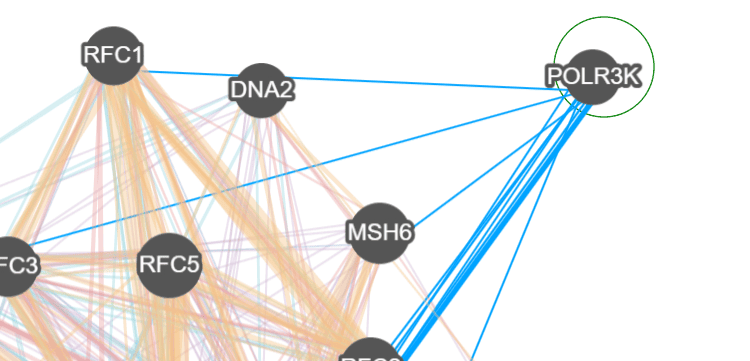
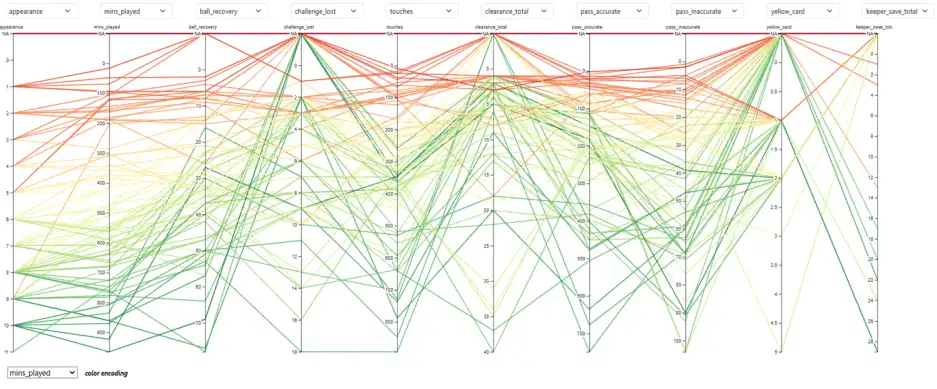
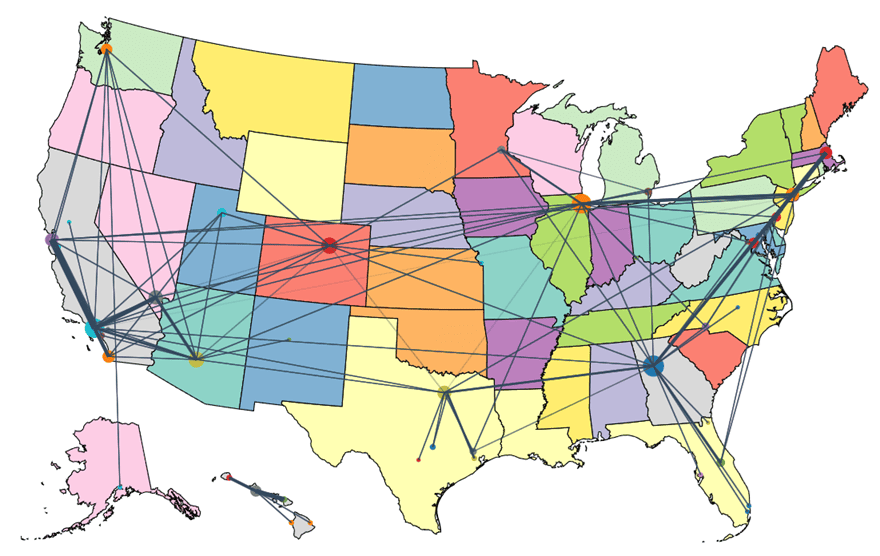
Data Visualizations with D3
Used D3 to create Data Visualizations for public datasets as part of Data Visualization class at TU Dresden.
Highlights
- Force Directed Graph
- Parallel Coordinate Plot
- US Airports Visualization
- Stack: JavaScript, D3.js
Distance Aware Vision Transformer
Improved model accuracy for cancer detection in whole slide images by designing a distance-aware Vision Transformer (ViT) that incorporated spatial relationships between patches into the self-attention mechanism.
- Stack: PyTorch
Deep Reinforcement Learning Pac-Man
Using Deep Reinforcement Learning models to learn how to play Pac-Man based on
interaction wiith the game
and feedback received.
- Stack: PyTorch, Pygame